What Are IT Chargebacks and How Do They Work

IT budgets often appear unfair when every charge is lumped together on a single line item without tying costs to the specific teams that consumed cloud instances, SaaS subscriptions, or storage space. Without that link, conversations about value quickly drift into disputes over headcount.
Chargebacks untangle that knot by turning raw usage data into clear, line-item invoices. The approach sits between simple showback reports and full market pricing; finance gains the clarity it needs, and users feel gentle pressure to use services more carefully. When the model is set up well, it scales from laptops to data centers to every cloud service in between.
This guide shows IT and finance teams how to build a chargeback model that stakeholders will use. Inside, you’ll find plain explanations of the concept, working models, business benefits, and a step-by-step rollout plan.
Table of Contents
- What are IT chargebacks?
- How do chargebacks work daily?
- Why adopt chargebacks over traditional budgets?
- Which chargeback models fit different environments?
- How can leaders build a chargeback practice?
- Conclusion
- Audit your company's SaaS usage today
What are IT chargebacks?
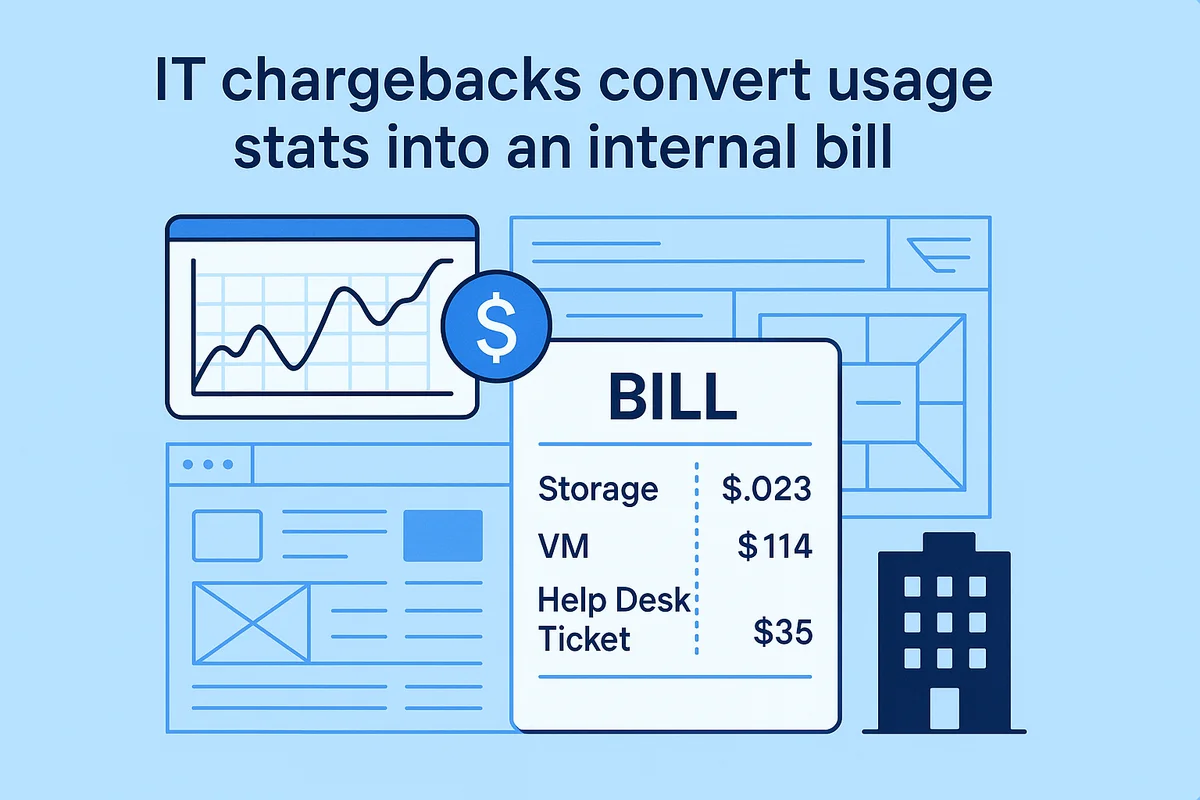
IT chargebacks convert usage stats into an internal bill, not a fuzzy budget entry. Put a price on every gigabyte or help-desk ticket and technology starts to feel like electricity: each department sees what it used and gets charged for it.
Traditional lump-sum budgets hide the detail because the CIO gets one big pool of cash and spends it where needed. Showback reports close part of that gap by publishing usage and cost data, yet no money moves. Chargeback takes the extra step; Accounting books a receivable from Marketing or HR and credits the IT cost center, so the expense lands where it belongs.
No single formula fits every service, and the eligible list is wider than many teams expect.
- Virtual machines running in Amazon Web Services or Microsoft Azure
- Seats on SaaS platforms such as Salesforce or Adobe Creative Cloud
- End-user computing bundles that wrap laptops, software images, and help-desk support
- Shared assets like on-prem storage arrays, network backbone ports, or security scanning tools
These services already expose metering hooks such as cloud usage reports, license counters, or CMDB attributes, and those data points feed the chargeback calculator.
Two practical benefits keep the finance team and IT leaders aligned on chargeback. Clear cost visibility helps each department match spending with value; a data-heavy analytics group quickly sees why its bill towers over payroll’s. Second, the pay-for-what-you-use rule changes behavior. The cultural shift is subtle yet powerful: IT no longer looks like a flat tax; it acts like a priced catalog that managers can dial up, trim, or swap just like any other vendor relationship.
How do chargebacks work daily?
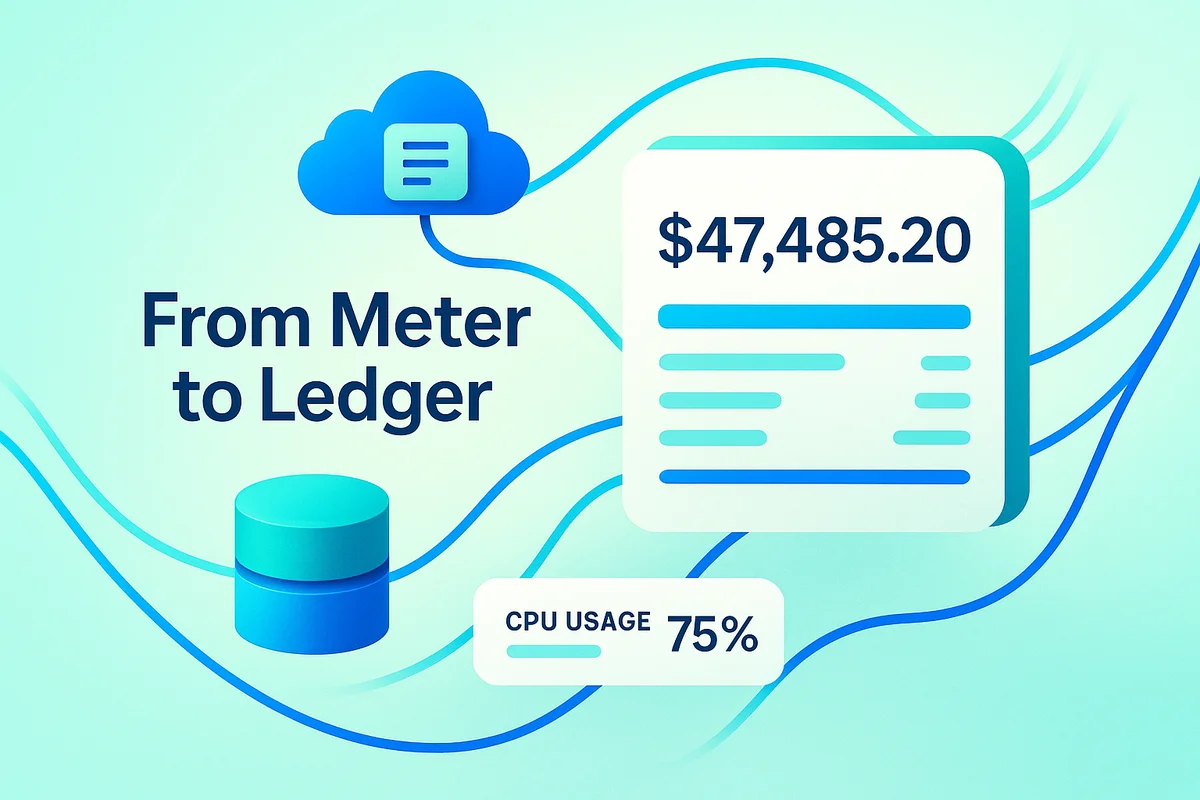
An IT chargeback only works if daily mechanics run smoothly from meter to ledger.
Accurate usage data always starts the entire chargeback chain on solid ground. Cloud platforms push hourly log files, while on-prem tools pull CPU, storage, and ticket counts from the CMDB or service desk. These records land in a staging lake, where scripts tag each entry with the right cost center and the matching unit rate. One bad tag can spill into hundreds of wrong invoices, so reconciliation jobs flag gaps before finance ever sees them.
After the data is tagged, teams turn to the math that transforms raw usage into dollar amounts. Rates from last quarter’s service catalog get multiplied by metered units, then rounded to the penny for general-ledger compliance. Many teams load the results straight into SAP S/4HANA or Oracle Fusion every night, which keeps work in progress visible to controllers instead of appearing as an end-of-month surprise. When volume spikes threaten rate accuracy, capacity planners push forecast data back into the pricing table so the next cycle’s invoices still make sense.
- CMDB records automatically map every server and application instance to its accountable owners
- Cloud billing exports reliably supply all raw consumption figures for processing
- ERP or ITFM suites join, price, and post the numbers
- BI dashboards quickly surface spend anomalies for analysts and product owners
- Ticketing systems efficiently manage dispute workflows and route credit approvals
When the numbers are final, the finance stack has to show them in formats people read. PDF statements satisfy cost-center managers who just want a bill to pay, while Power BI or Tableau dashboards let service owners drill from “$42,380 on storage” down to the specific snapshot or bucket. Spotify pipes its Google Cloud export into BigQuery and then into its internal finance portal, refreshing every six hours; that cadence cut variance between forecast and actual to under two percent.
Consistent guardrails keep the whole cycle honest without slowing it to the pace of manual spreadsheets. IT finance teams set a seven-day window for disputes, after which charges lock. Monthly close dates mirror corporate accounting so chargebacks reconcile with external reporting. Still, experienced shops run a soft close first, giving teams time to review numbers without halting the ledger. Automation handles 90 percent of postings, yet a single analyst usually reviews high-dollar anomalies, ensuring that software speed never replaces human sense.
Why adopt chargebacks over traditional budgets?
Traditional lump-sum budgets obscure both the true cost of technology and who uses it. When teams can spin up cloud servers or SaaS seats in minutes, finance teams scramble to match surprise invoices to a fixed annual plan. Elastic capacity encourages innovation yet undercuts predictability, so leaders hunt for a way to link spending to demand while the meters are running.
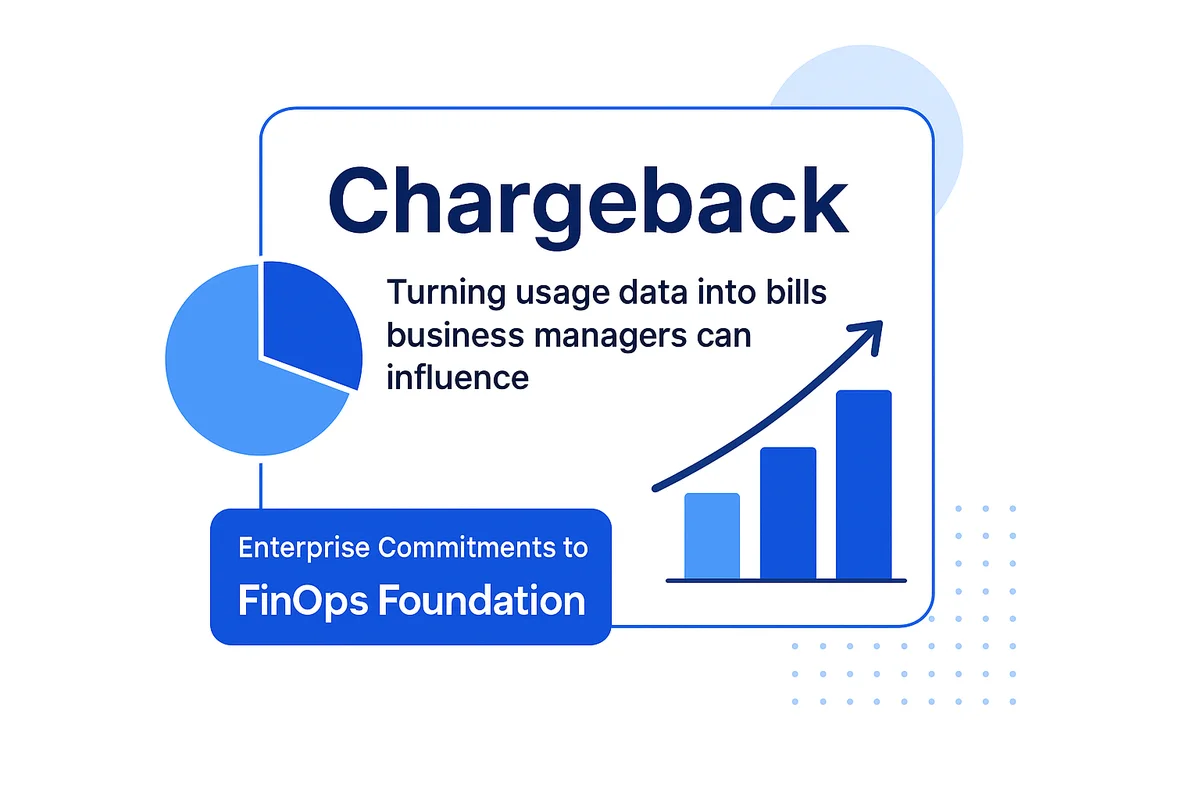
Chargeback fills that gap by turning raw usage data into bills business managers can influence. The push usually starts when at least one of these pressures hits a tipping point:
- Escalating cloud spending with no clear owner after the first year’s “lift and shift.”
- CFO mandates for service-level profitability and clean audit trails.
- Product teams requesting proof that IT pricing matches the value they receive.
- Enterprise commitments to FinOps Foundation best practices that spotlight unit economics.
Once costs land on an internal invoice instead of a blanket IT overhead line, habits change fast. Developers abandon oversized test environments after seeing the monthly total. Marketing leaders weigh premium analytics add-ons against expected revenue rather than assuming the platform is free. Budget meetings shift from begging for dollars to negotiating service levels and shared-savings goals.
Real-world data shows how fast those behavioral changes convert into measurable savings. Adobe reported a 23 percent drop in idle AWS resources within six months of introducing usage-based chargeback, a figure shared at the FinOps X conference. Gartner surveys note 15 to 20 percent cuts in unplanned cloud overages after a full year, freeing funds for modernization projects that once languished.
Labeling every gigabyte with a price can trigger “IT tax” resentment if the story stops at the invoice. Successful teams pair the bill with plain-language dashboards that link each charge to a business result, then funnel a slice of savings into visible wins such as faster release pipelines or stronger security controls. Treated as a partnership, not a penalty, chargeback reframes cost debates as value discussions that endure.
Which chargeback models fit different environments?
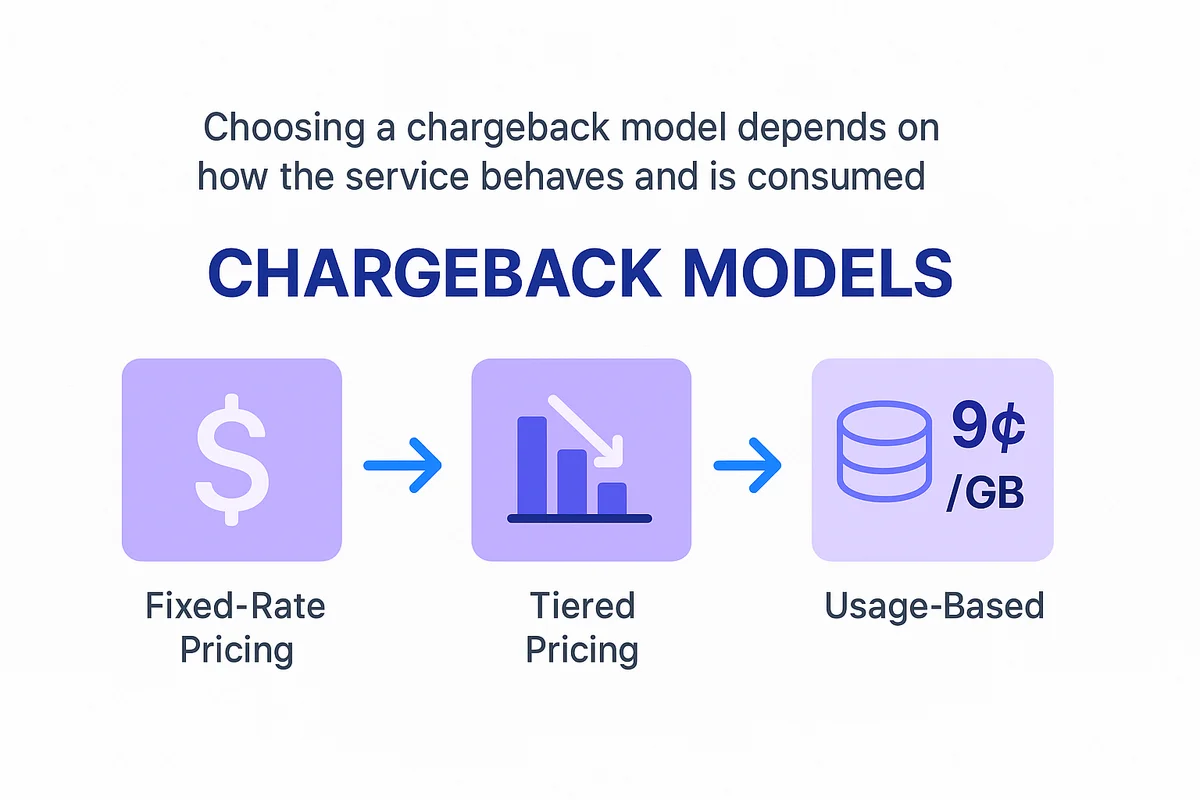
Choosing a chargeback model depends on how the service behaves, how it is consumed, and how much accounting hassle the team can stomach. Some groups want clear cost cues, while others just need an fair split that won’t bury staff in spreadsheets.
Fixed-rate pricing fits situations with steady demand and stable unit costs, for example virtual desktop support or a managed print fleet. Tiered pricing introduces a volume discount curve, where storage might cost nine cents per gigabyte for the first 10 TB and six cents after that, which nudges teams away from hoarding without hourly metering. Pure usage models copy cloud elasticity: every gigabyte, ticket, or API call lands on the bill, so they suit spiky services such as Amazon Web Services EC2 or Kubernetes clusters.
Most teams end up combining models rather than committing to just one. A hybrid approach appears when leaders realize no single method satisfies every expectation for fairness, simplicity, and predictability. Use fixed prices for baseline capacity, then layer usage charges for bursts; finance still gets stability while product teams see a cue to shut down idle test rigs.
Before choosing, take time to map common objectives to specific model types:
- Encourage conservation of scarce resources
- Spread sunk costs no one can avoid
- Offer predictable month-end accruals
- Bill back variable cloud spend with near-real-time data
Cost accountants typically organize expenses into direct and indirect pools. Direct costs tie cleanly to a service record, such as Azure CPU hours, so they’re easy to meter. Indirect costs, including network backbone, security operations, or IT finance salaries, ride an allocation key such as headcount or percentage of revenue. Capital expenses like servers depreciate across useful life, while operational items like SaaS licenses flow straight through each month. Strive for transparency; hidden overhead inflates rates and sparks pushback.
While comparing options, always balance administrative effort against pricing accuracy. A 98 percent precise, fully metered model loses its charm if it steals three analyst days every week. Start lean, inspect variance trends, and only add complexity when the savings outweigh the bookkeeping load.
How can leaders build a chargeback practice?
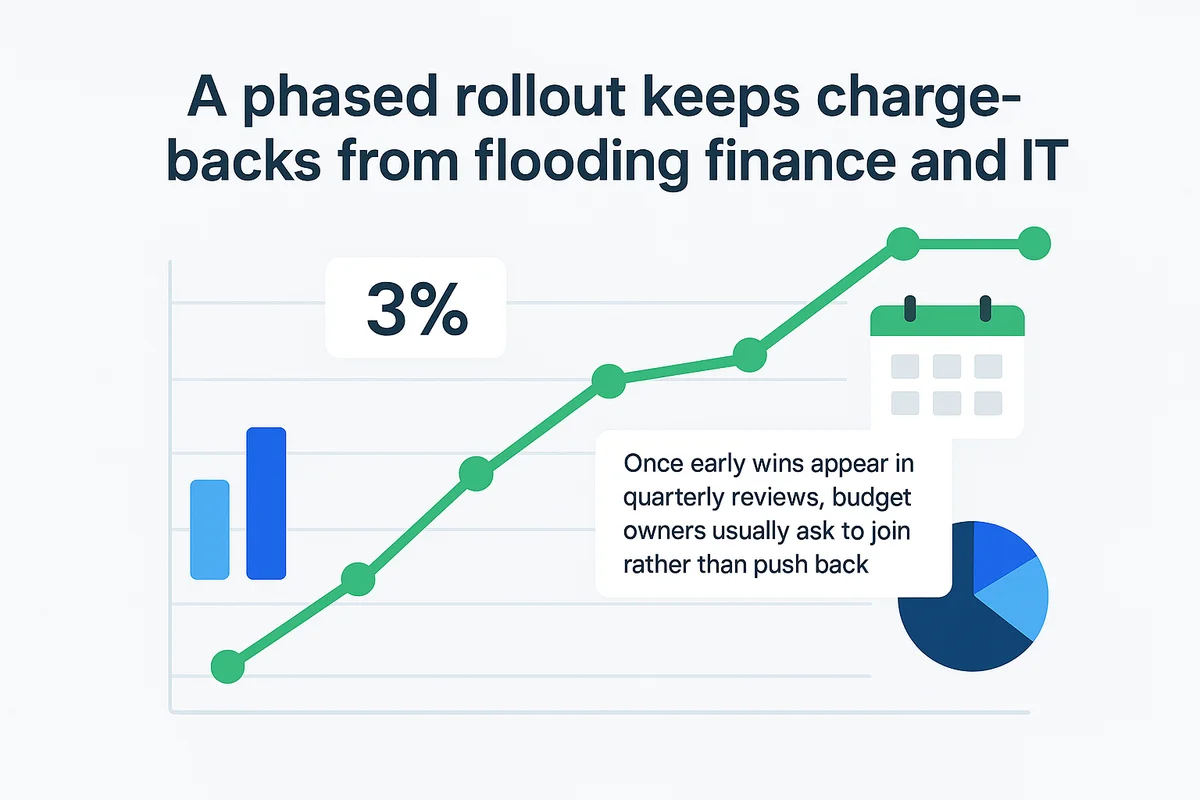
A phased rollout keeps chargebacks from flooding finance and IT. Start small, show results quickly, and word spreads inside the company. Once early wins appear in quarterly reviews, budget owners usually ask to join rather than push back.
Most teams follow five practical steps that build steady momentum.
- Baseline current spending by pulling last year’s invoices, usage reports, and CMDB entries into one clean worksheet.
- Run a contained pilot on a low-risk service, such as virtual machines or print queues, so any surprise stays manageable.
- Scrub the rate card after the pilot, accounting for seasonality, volume discounts, and hidden shared costs before showing prices to a wider audience.
- Expand by business line rather than technology tower, mirroring how executives scan their P&L statements when approving new spending.
- Schedule quarterly reviews and an annual true-up to ensure the model stays aligned with real consumption.
Strong governance keeps the math honest and the politics calm. Create a council with a finance lead, an IT service owner, and one delegate from each charged unit; three voices avoid deadlocks. Publish an FAQ in plain English and give managers two months to dispute invoices before closing the books. Change managers should brief newcomers during onboarding so the process feels routine, not punitive.
Clear metrics keep teams focused on fixing issues rather than pointing fingers at each other. Three numbers surface problems early: recovery rate (billed versus collected), variance between planned and actual unit cost, and the Net Promoter Score of service consumers. If recovery slips below 95 percent, investigate root causes, often stale asset records or wrongly tagged cloud buckets, before even thinking about higher rates.
Thoughtful automation lets the chargeback model grow quickly without adding a wave of new hires. Linking Apptio buckets to SAP or Oracle GL cuts manual entries. BI tools like Power BI turn weekly cost snapshots into color-coded dashboards that managers grasp in seconds. Feeding twelve months of usage data into a lightweight AutoML service takes forecasting further; even a basic regression flags capacity crunches long before they hit the bill. Keep refining, and chargeback shifts from bookkeeping chore into a live market signal that guides every tech dollar.
Conclusion
Chargebacks turn raw consumption data into line items everyone understands. The article covered the basics, compared them with showbacks, and listed the services that usually hit the bill. It also showed how metering, simple math, and regular reviews turn the concept into habit, supported by dashboards and ERP exports. Finally, we examined why leaders lean toward chargebacks, when other models make sense, and how to introduce the change without ruffling feathers.
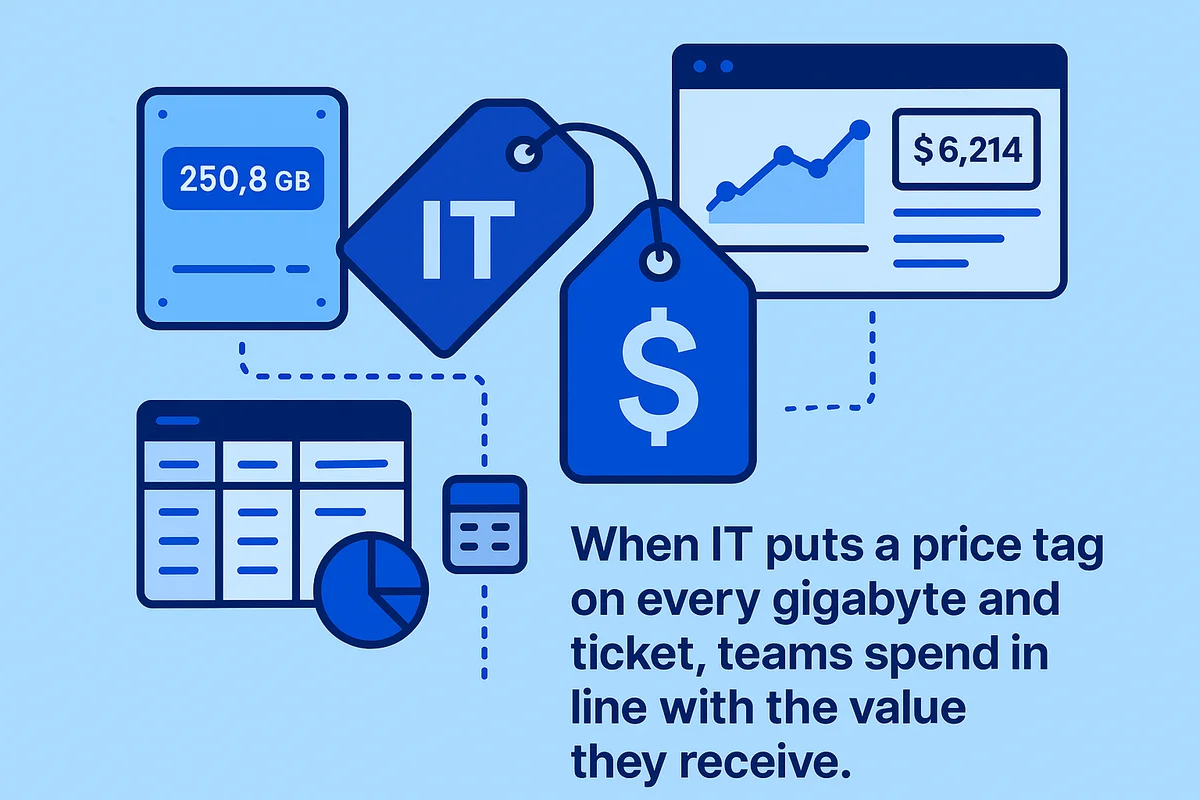
When IT puts a price tag on every gigabyte and ticket, teams spend in line with the value they receive.
Audit your company’s SaaS usage today
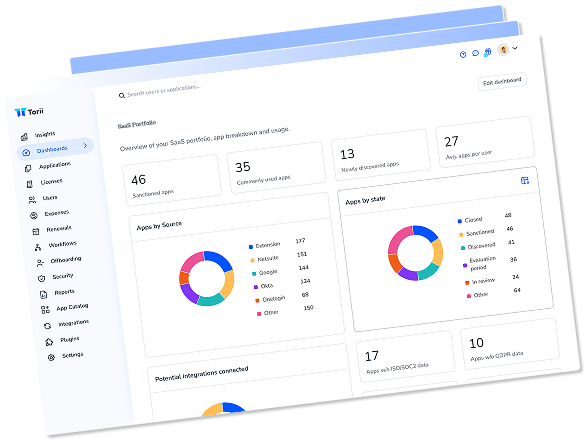
If you’re interested in learning more about SaaS Management, let us know. Torii’s SaaS Management Platform can help you:
- Find hidden apps: Use AI to scan your entire company for unauthorized apps. Happens in real-time and is constantly running in the background.
- Cut costs: Save money by removing unused licenses and duplicate tools.
- Implement IT automation: Automate your IT tasks to save time and reduce errors - like offboarding and onboarding automation.
- Get contract renewal alerts: Ensure you don’t miss important contract renewals.
Torii is the industry’s first all-in-one SaaS Management Platform, providing a single source of truth across Finance, IT, and Security.
Learn more by visiting Torii.